1. What is AWS CloudWatch?
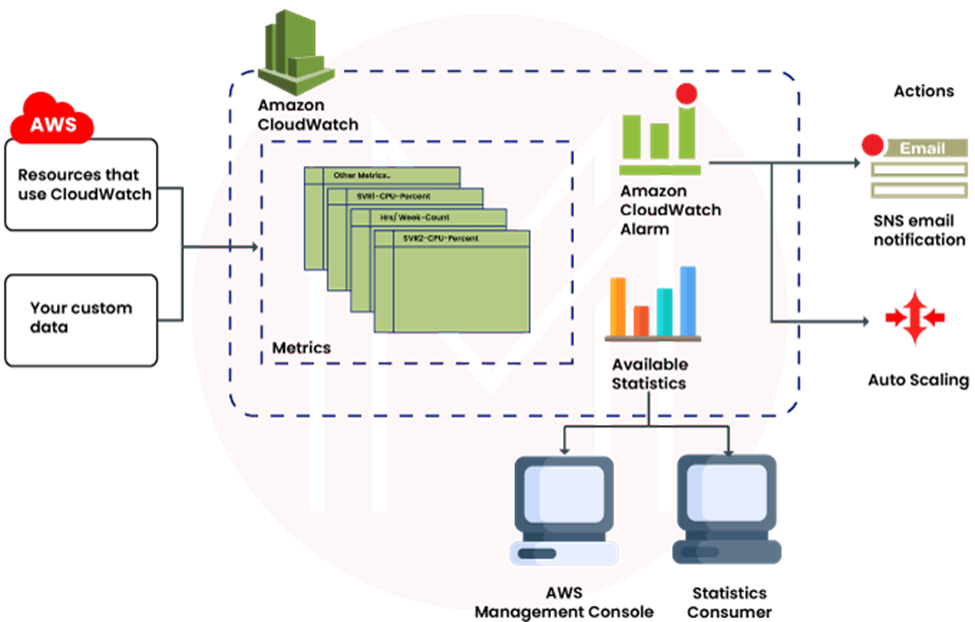
AWS CloudWatch is a monitoring service for AWS resources and the applications running on AWS. CloudWatch provides data and actionable insights to monitor your applications, respond to system-wide performance changes, optimize resource utilization, and get a unified view of operational health.
2. Can you explain what a metric is in the context of CloudWatch?
A metric is a time-series data point that represents a specific measurement within your AWS environment. You can use CloudWatch to collect and track metrics from AWS resources in order to monitor your environment and identify issues.
3. Can you give me some examples of metrics provided by CloudWatch?
CloudWatch provides metrics on a variety of AWS services, including EC2, EBS, ELB, and RDS. For each service, CloudWatch provides a set of default metrics, which can be further customized by the user. For example, for EC2 instances, CloudWatch provides metrics on CPU utilization, network traffic, and disk activity.
4. What are some important concepts for using CloudWatch?
Some important concepts to keep in mind when using CloudWatch include understanding how to create alarms, understanding the different types of metrics that can be monitored, and knowing how to use the CloudWatch Logs feature. Additionally, it can be helpful to have a general understanding of how Amazon Web Services (AWS) work in order to get the most out of CloudWatch.
5. How can an application send custom metrics to CloudWatch?
An application can send custom metrics to CloudWatch by using the CloudWatch API. This allows the application to push custom metrics to CloudWatch, which can then be used to monitor the application.
6. How do you create a dashboard in CloudWatch?
You can create a dashboard in CloudWatch by clicking on the “Dashboards” link in the left sidebar, and then clicking the “Create Dashboard” button. From there, you will be prompted to give your dashboard a name and description, and then you can begin adding widgets.
7. What are Alarms? How are they used in CloudWatch?
Alarms are used in CloudWatch to monitor specific metrics and to trigger actions based on thresholds that you set. For example, you could create an alarm that would send you an email if the CPU utilization of your EC2 instance exceeds 50%.
8. Is it possible to disable CloudWatch? If yes, how?
Yes, it is possible to disable CloudWatch. You can do this by going into the AWS console and selecting the CloudWatch service. From there, you can click on the “Actions” drop-down menu and select “Disable”.
9. How do you integrate CloudWatch with EC2 instances?
You can integrate CloudWatch with EC2 instances by installing the CloudWatch agent on the instances. The CloudWatch agent allows you to collect metrics and log files from your EC2 instances and send them to CloudWatch.
10. What’s the difference between Amazon CloudWatch and Google Stackdriver?
Amazon CloudWatch is a monitoring service for AWS resources and applications, while Google Stackdriver is a monitoring service for Google Cloud Platform resources and applications. Both services provide similar features, such as the ability to set alarms, create dashboards, and view logs. However, there are some key differences between the two services. For example, Amazon CloudWatch includes support for monitoring Amazon DynamoDB tables, while Google Stackdriver does not. Additionally, Google Stackdriver offers support for monitoring Google Kubernetes Engine clusters, while Amazon CloudWatch does not.
11. How is billing calculated when using CloudWatch?
CloudWatch charges for the number of alarms that you have created, as well as the number of metric filters, the number of logs that you have created, and the number of metric alarms that you have created.
12. What features does CloudWatch provide that other monitoring tools don’t?
CloudWatch provides a number of features that other monitoring tools don’t, including the ability to monitor AWS resources in real-time, set alarms to notify you of changes or issues, and automatically take action in response to changes or issues that are detected. Additionally, CloudWatch can be used to monitor non-AWS resources, such as on-premises servers.
13. What are log groups and log streams? How are they different from each other?
Log groups and log streams are both used in AWS CloudWatch in order to monitor and manage logs. Log groups are used to group together similar logs, while log streams are used to monitor individual logs. Log groups can contain multiple log streams, but each log stream can only belong to one log group.
14. Does CloudWatch automatically remove old logs?
No, CloudWatch does not automatically remove old logs. You will need to manually remove old logs when you no longer need them.
15. Do you need permission to publish logs to CloudWatch?
You need permission to publish logs to CloudWatch if you want to create a new log group or log stream, or if you want to publish to an existing log group or log stream. You also need permission to delete a log group or log stream.
16. What is retention period? What effect does it have on your data?
Retention period is the amount of time that CloudWatch will keep your data. The effect that it has on your data is that it will be deleted after the retention period expires.
17. How can you delete all log files from a particular group?
You can delete all log files from a particular group by using the AWS CloudWatch console. From the CloudWatch console, select the log group that you want to delete, then select the Actions drop-down menu. From the Actions menu, select Delete Log Group.
18. What is the maximum number of alarms that can be associated with each action?
The maximum number of alarms that can be associated with each action is 100.
19. What is the default limit for the number of dashboards that you can display at one time?
The default limit for the number of dashboards that you can display at one time is 100.
20. Can you explain what access policies are in the context of CloudWatch?
Access policies are essentially the rules that you set in order to determine who has access to your CloudWatch data and what actions they are allowed to perform. You can set up access policies so that only certain users or groups can view your data, or you can allow all users to view your data but only allow certain users or groups to perform certain actions.
21. What is a CloudWatch Alarm?
Ans:
The new CloudWatch Alarms feature helps in monitoring CloudWatch metrics and receive notifications when they fall outside of the levels (high or low thresholds) you set. Each metric can have multiple Alarms, each with its own set of actions.
The status of a CloudWatch Alarm is always one of three: OK, ALARM, or INSUFFICIENT DATA. The Monitor is in the OK state whenever the metric is within the acceptable range which you have defined. When it reaches a certain threshold, it enters the ALARM state. The monitor enters the INSUFFICIENT DATA state when the data required to make the decision is missing or incomplete.
22. What is the difference between CloudTrail and CloudWatch?
Ans:
CloudWatch monitors and reports on the health and performance of AWS services and resources. CloudTrail, on the other hand, is a log of all actions that have occurred within your AWS environment
23. How to delete alarms in AWS CloudWatch Console?
Ans:
Use the following command to delete the alarms in AWS CloudWatch Console:
aws cloudwatch delete-alarms --region us-east-2 --alarm-names
24. What is CloudWatch Metric Streams?
Ans:
CloudWatch Metric Streams is a feature that allows you to stream CloudWatch metrics to a destination of your choice indefinitely with minimal setup and configuration. It is a fully managed solution that eliminates the need for you to write code or maintain infrastructure. Users can configure a metric stream to destinations such as Amazon Simple Storage Service with a few clicks (S3). To maintain your operational dashboards up to date, users could also send the metrics to a number of third-party service providers.
25. What is Amazon CloudWatch ServiceLens?
Ans:
Amazon CloudWatch ServiceLens is a new feature that lets you visualise and analyse the health, performance, and availability of your applications in one place. Amazon CloudWatch ServiceLens is accessible in all public AWS Regions that offer AWS-X-Ray.
26. What is Amazon CloudWatch Synthetics?
Ans:
To monitor your endpoints and APIs, you can use Amazon CloudWatch Synthetics to create canaries, which are configurable scripts that run on a schedule. Canaries take the same routes and perform the same actions as customers, allowing you to continuously validate your customer experience even if there is no customer traffic on your applications. You can detect problems before your customers do by using canaries.
Synthetic Monitoring is an effective way of testing a website or web service by simulating visitor requests to test for availability, performance, and functionality.
27. What are Canaries in Amazon CloudWatch Synthetics?
Ans:
Scripts written in Node.js or Python are known as Canaries. In your account, users create Lambda functions that use Node.js or Python as a framework. Canaries support both the HTTP and HTTPS protocols.
28. How do I send Grafana from CloudWatch metrics?
- Install Grafana : Follow the steps to Install Grafana.
- Go to AWS -> IAM -> Policies.
- Add below JSON in policy -> Create Policy
{
"Version": "2023-10-23", -- current Date
"Statement": [
{
"Sid": "AllowReadingMetricsFromCloudWatch",
"Effect": "Allow",
"Action": [
"cloudwatch:ListMetrics",
"cloudwatch:GetMetricStatistics",
"cloudwatch:GetMetricData"
],
"Resource": "*"
},
{
"Sid": "AllowReadingTagsInstancesRegionsFromEC2",
"Effect": "Allow",
"Action": [
"ec2:DescribeTags",
"ec2:DescribeInstances",
"ec2:DescribeRegions"
],
"Resource": "*"
}
]
}
4. IAM -> Roles -> Create Role -> Select AWS Service / EC2
5. Attach Permission policies
6. IAM -> Users and click Add User ->Attach existing policies -> copy Access Key ID, your Secret Key
7. EC2 -> Instances-> Select Grafana Server and click on Actions -> Instance Settings -> Attach/Replace IAM Role -> Attach your Grafana IAM Role to the instance.
8. Log in to your Grafana Server using Terminal as root user and provide Access Key ID, your Secret Key:
# vim /usr/share/grafana/.credentials
aws_access_key_id = 000000000000
aws_secret_access_key = 0000000000
region = us-west-2
# chmod 0644 .credentials
9. Grafana -> Navigate to Data Sources -> Select CloudWatch Type
10. Create Dashboard -> Select Graph -> Select Panel Title -> edit and provide namespace.
29. What does Amazon CloudWatch Synthetics work?
Canaries are pre-programmed scripts that run on a predetermined schedule. You can use Amazon CloudWatch Synthetics to create canaries to monitor your endpoints and APIs. The canaries travel the same routes as consumers and perform the same tasks, allowing you to validate the quality of the user experience even when no actual customer activity is occurring on your apps. You can detect problems before your clients do by using canaries.
By simulating the queries of potential visitors, a method known as "synthetic monitoring" can be used to evaluate the availability, performance, and functionality of a website or online service.

30. How Can I Implement Cloudwatch Access Management Policies?
You can determine which CloudWatch operations a user associated with your AWS Account can carry out using the integration that CloudWatch provides with AWS Identity and Access Management (IAM). Using IAM to restrict who can view the data in CloudWatch for particular resources is impossible. It is impossible to give a single individual access to the CloudWatch data for, for example, just one group of instances or a single LoadBalancer. All cloud resources that CloudWatch uses are subject to the permissions that IAM grants. Furthermore, IAM roles are not supported by the Amazon CloudWatch command line tools.
31. How does Amazon CloudWatch work?
Your applications and infrastructure resources may be monitored and managed using Amazon CloudWatch, which offers a unified solution. It is a web service you can use to gather metrics, understand your application and the infrastructure supporting it, and automatically respond to changes. You can monitor AWS resources with Amazon CloudWatch and adjust the monitoring to your company's requirements.
32. Can I Access The Metrics Data For A Terminated Ec2 Instance Or A Deleted Elb?
Answer :
Yes, CloudWatch stores metrics for terminated EC2 instances or deleted ELBs for 15 months.
No comments:
Post a Comment